A day with solar + battery
kinemo render examples/solar_day.py.A component integrates power into a state of charge, fires full/empty events with hysteresis, and reads its clock from a context; the load curve comes from a polars DataFrame.
Uses: k.Component, k.integrate, k.when, k.context, k.interp — see the API reference.
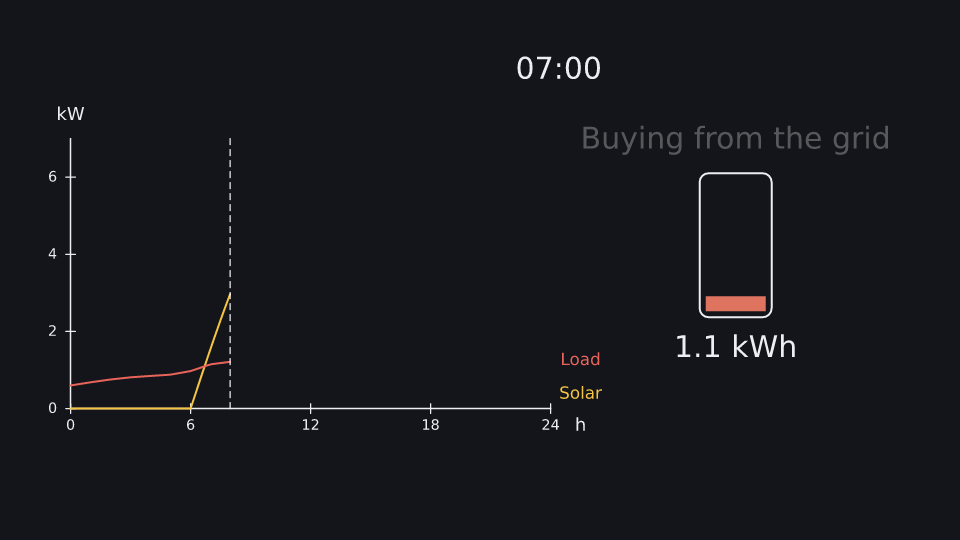
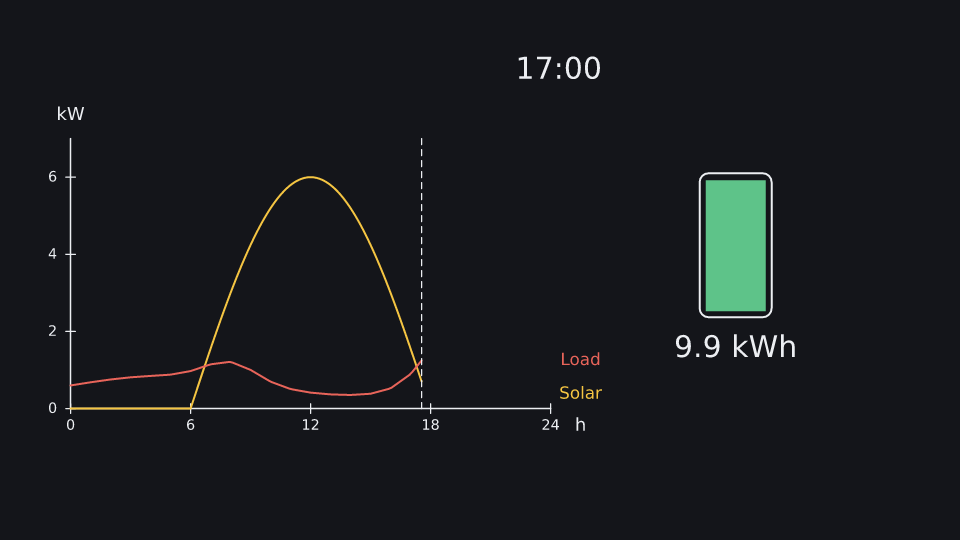
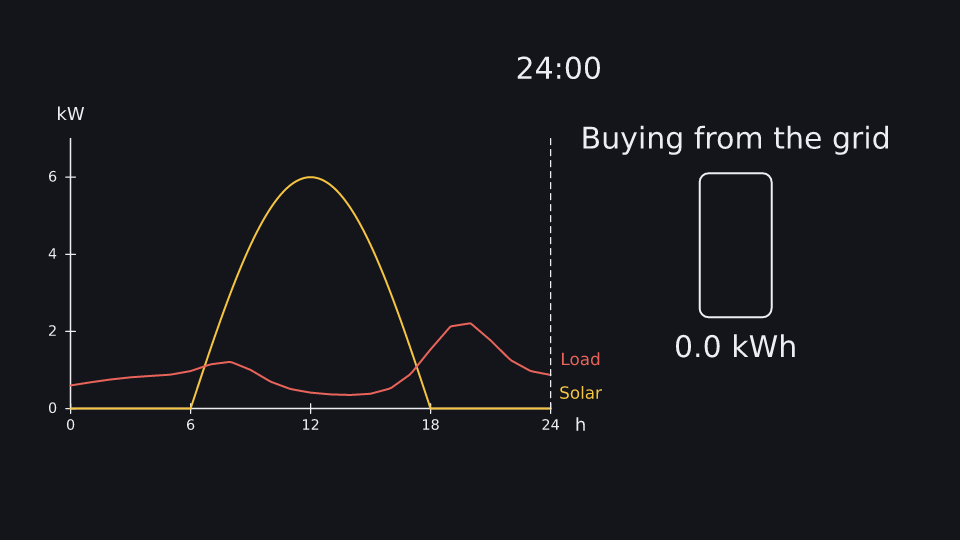
Run it: kinemo dev examples/solar_day.py · render: kinemo render examples/solar_day.py
from pathlib import Path

import polars as pl

import kinemo as k

Clock = k.context("clock", default=k.time)
profile = pl.read_csv(Path(__file__).parent / "data" / "typical_load.csv")  # columns: hour, kw


class Battery(k.Component):
    power:    k.Prop[float] = k.prop(0.0)          # kW; + charges, − discharges
    time:     k.Prop[float] = k.from_context(Clock) # hours
    capacity: float = 10.0                          # kWh, static
    initial:  float = k.field(0.2, range=(0, 1))

    soc:   k.Out[float]
    full:  k.Event
    empty: k.Event

    def build(self) -> k.Node:
        self.soc = k.integrate(self.power / self.capacity,
                               d=self.time, initial=self.initial, clamp=(0, 1))
        k.when(self.soc >= 1, self.full, rearm=self.soc < 0.95)
        k.when(self.soc <= 0, self.empty, rearm=self.soc > 0.05)

        self.body = k.RoundedRect(w=1.2, h=2.4, stroke=k.theme.fg)
        self.level = k.Rect(w=1.0, h=self.soc * 2.2,
                            fill=self.soc.map(lambda v: k.mix(k.RED, k.GREEN, v)), fill_opacity=1, stroke_width=0) \
                        .place(inside=self.body, align="bottom", pad=0.1)
        self.label = k.Text(lambda: f"{self.soc() * self.capacity:.1f} kWh") \
                        .place(below=self.body, gap=0.2)
        return k.Group(self.body, self.level, self.label)

    def enter(self) -> k.Animation:
        return k.seq(k.draw(self.body), k.grow(self.level, from_="bottom"),
                     k.fade_in(self.label))


def solar_curve(h: float) -> float:
    return k.max(0, 6 * k.sin(k.pi * (h - 6) / 12))  # traceable → native


def load_curve(h: float) -> float:
    return k.interp(h, profile["hour"], profile["kw"])  # Arrow → native


@k.scene(tail=1.0)
def solar_day(s: k.Scene):
    hour = k.time.map(lambda t: k.min(t * 2, 24))     # 12 s of video = 24 h
    solar, load = hour.map(solar_curve), hour.map(load_curve)

    ax = k.Axes(x=(0, 24, 6), y=(0, 7), labels=("h", "kW")).place(at="left", margin=0.8)
    ax.plot(solar_curve, until=hour, color=k.YELLOW, label="Solar")
    ax.plot(load_curve, until=hour, color=k.RED, label="Load")
    ax.vline(at=hour, style="dashed")
    clock = k.Text(lambda: f"{k.floor(hour()):02.0f}:00").place(above=ax, align="right")

    with k.provide(Clock, hour):
        bat = Battery(power=solar - load, capacity=10).place(right_of=ax, gap=1.2)

    @bat.full.on
    def _(s: k.Scene, e: k.EventInfo) -> None:
        s.play(k.indicate(bat, color=k.GREEN))

    @bat.empty.on
    def _(s: k.Scene, e: k.EventInfo) -> None:
        notice = k.Text("Buying from the grid").place(above=bat)
        s.play(k.fade_in(notice))
        s.wait(1)
        s.play(k.fade_out(notice))

    s.add(ax, clock, bat)
    s.wait(12)